Start
27/03/23
Other parties involved
- Korec
- North Yorkshire Council
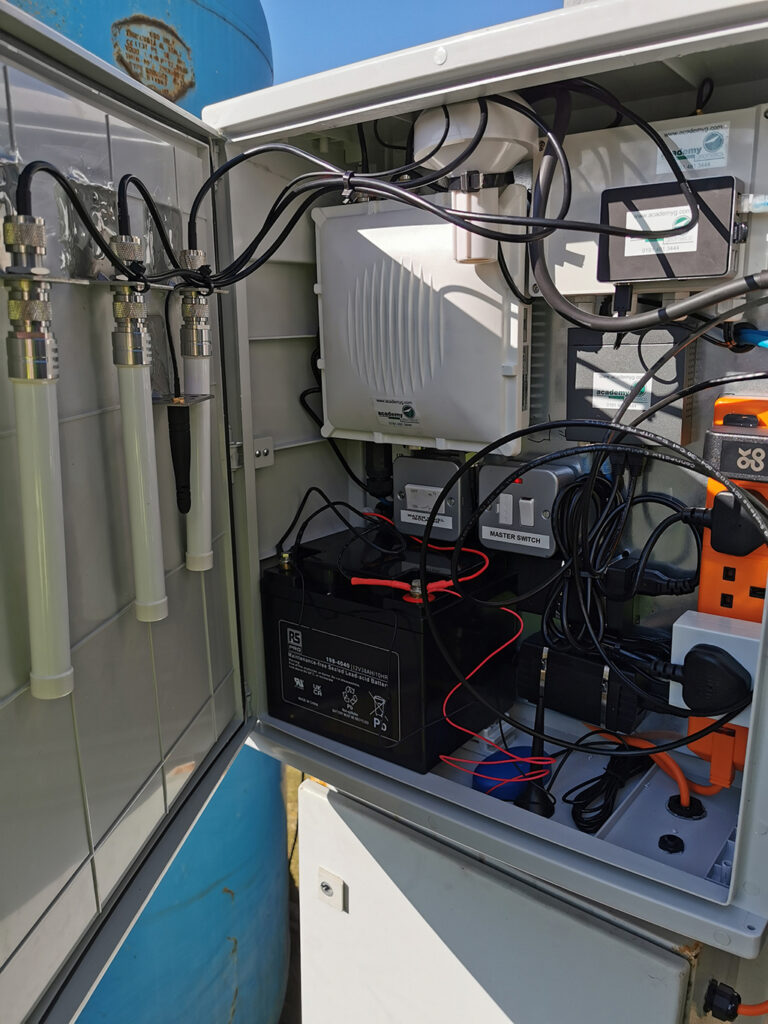
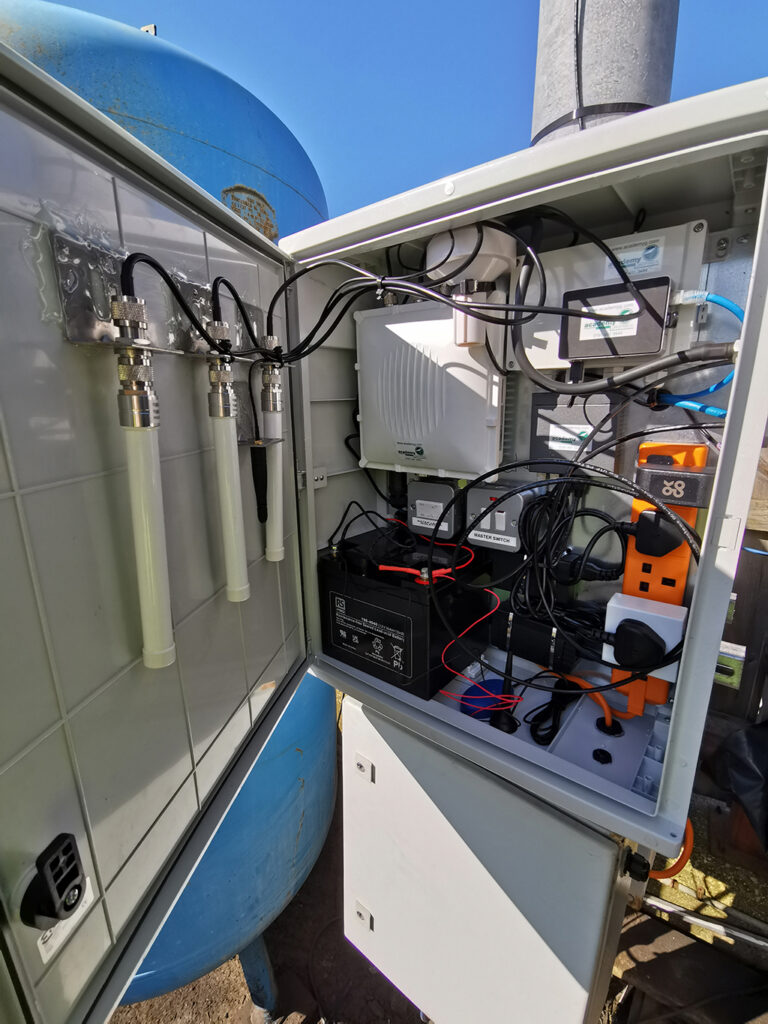
Move Solutions Devices
Other Sensors
- Water Level Detector
PROJECT OVERVIEW
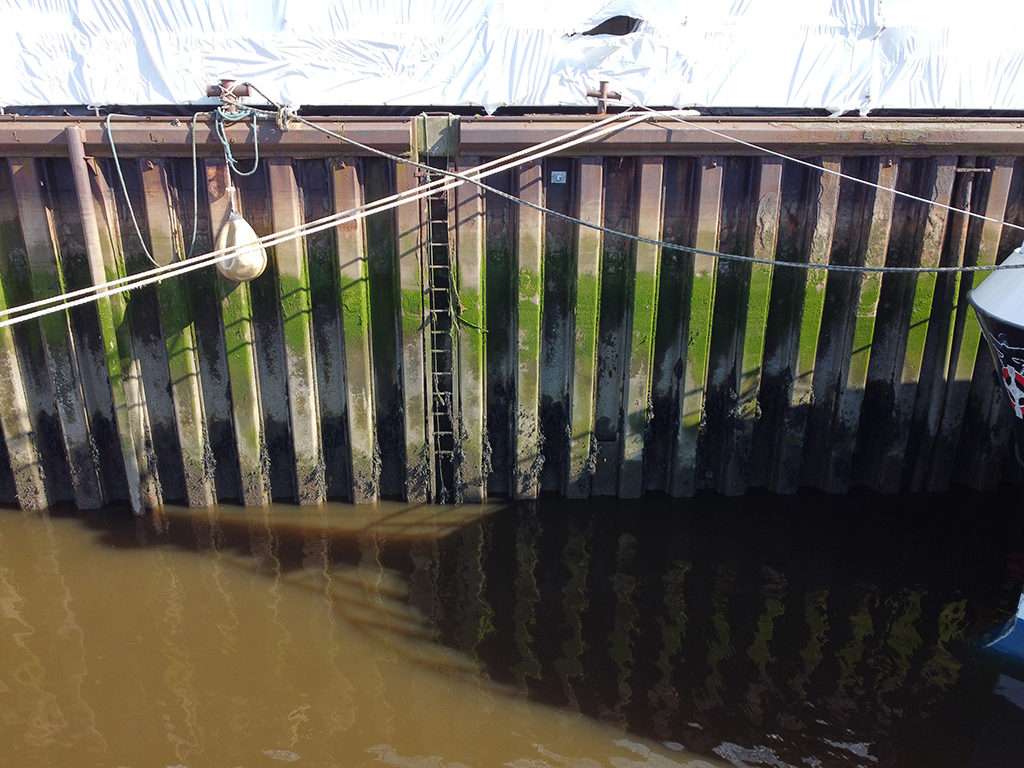
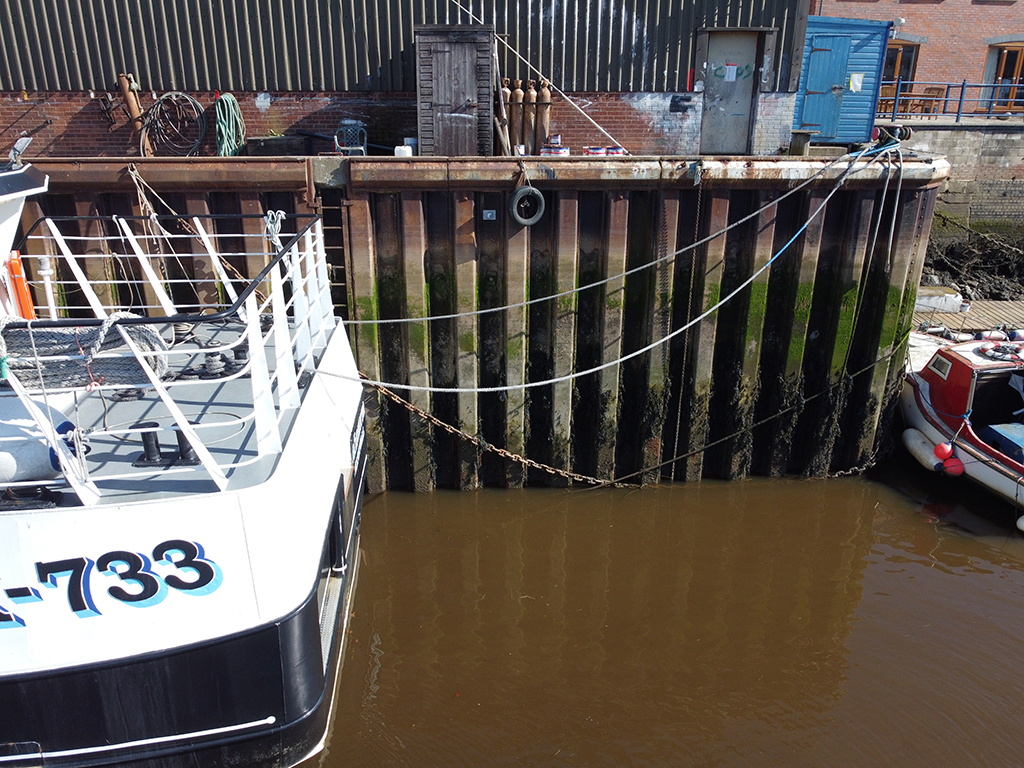
In August 2022, Academy Geomatics Ltd started conducting automated monitoring with a total station and prism for a local council. There were concerns that the quay wall might had been moving and the monitoring was aimed at verifying that. Since day trips to monitor the wall were not a long enough period of time to attest the consequences of the tidal effect on the wall, it was proposed to set up an automated total station and leave it there 24/7 for a month, receiving data every 5 minutes to accurately show the tidal effect on the structure.
Thanks to this monitoring system, it was possible to analyse the tidal effect on the quay wall, and to collect partial measurements of the quay wall movement caused by the change in water level. However, as the wall was shown to be moving, the council decided to continue the monitoring to be able to act promptly in case peaks of data were detected.
As good as the automated total station was, it had some flaws on this site, which were known at the start, but since the duration of the monitoring project was initially only planned to last 1 month, they were considered acceptable. One of the problems was the inter-visibility between the total station and the monitoring prisms that was interrupted depending on the tide level and the number of boats moored up against the quay wall.
MONITORING SYSTEM
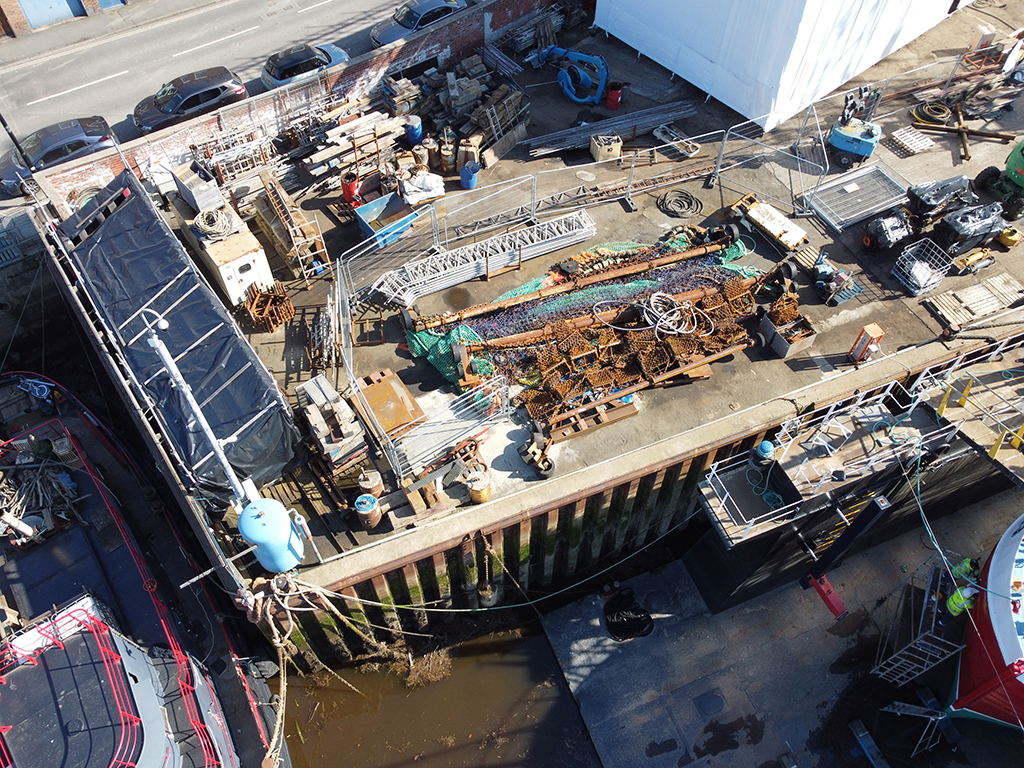
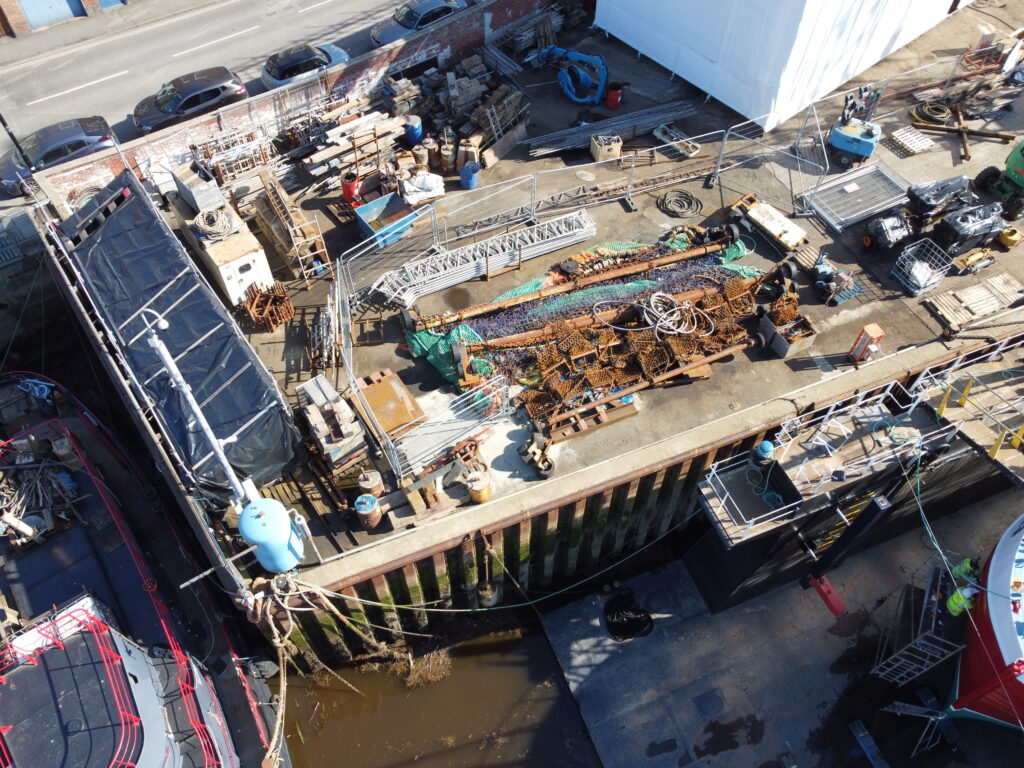
As it was then required a longer-term monitoring, Academy Geomatics proposed a system of 16 Tiltmeters and 4 Vibrometers as a better way of monitoring they quay wall, especially considering that the area the council was most concerned about was permanently obscured by a floating dry dock.
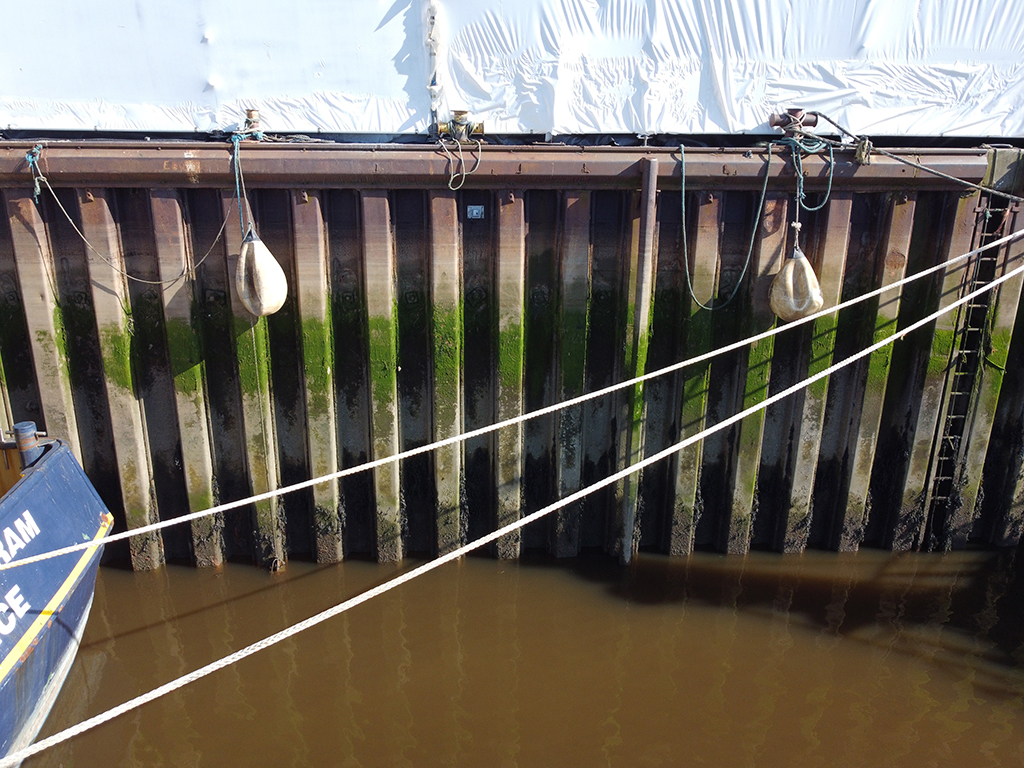
The installation took place on 27/03/23. The sensors were bolted to a metal plate and then the metal plate was ‘tek screwed’ to the metal sheet pile. That allows for easy removal and or replacement of the sensor in due course. An ultrasonic water level detector was also installed, wired to an analog node, so as to receive information about the water level and verify whether the movements of the quay wall were due to that or to the temperature.
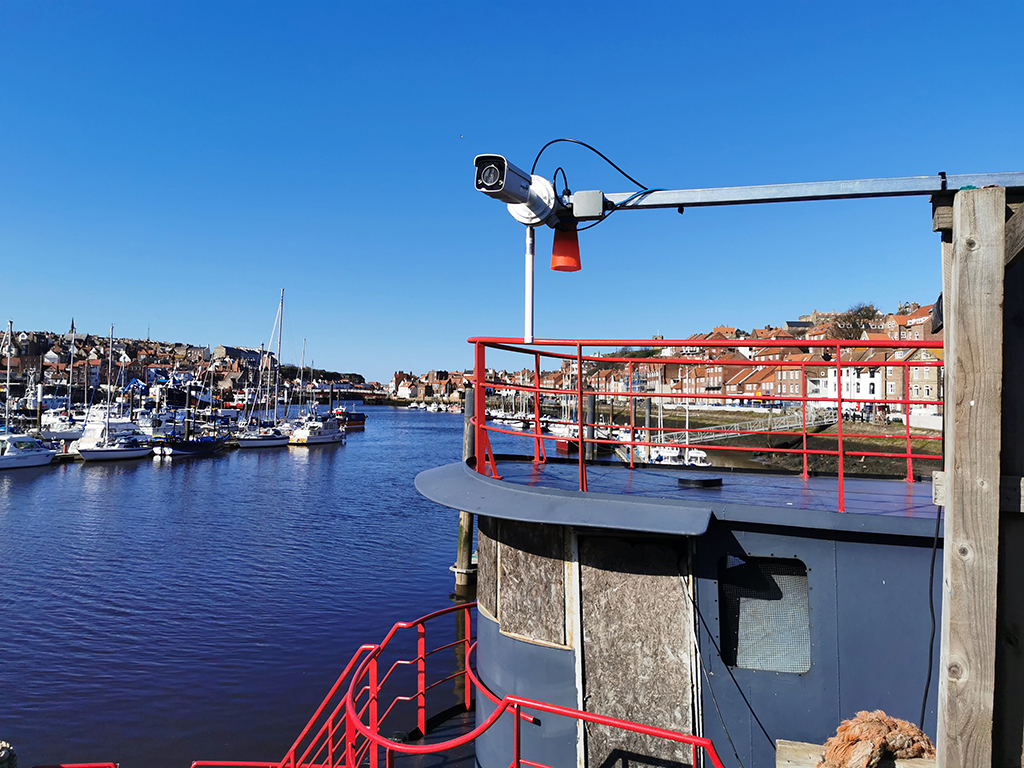
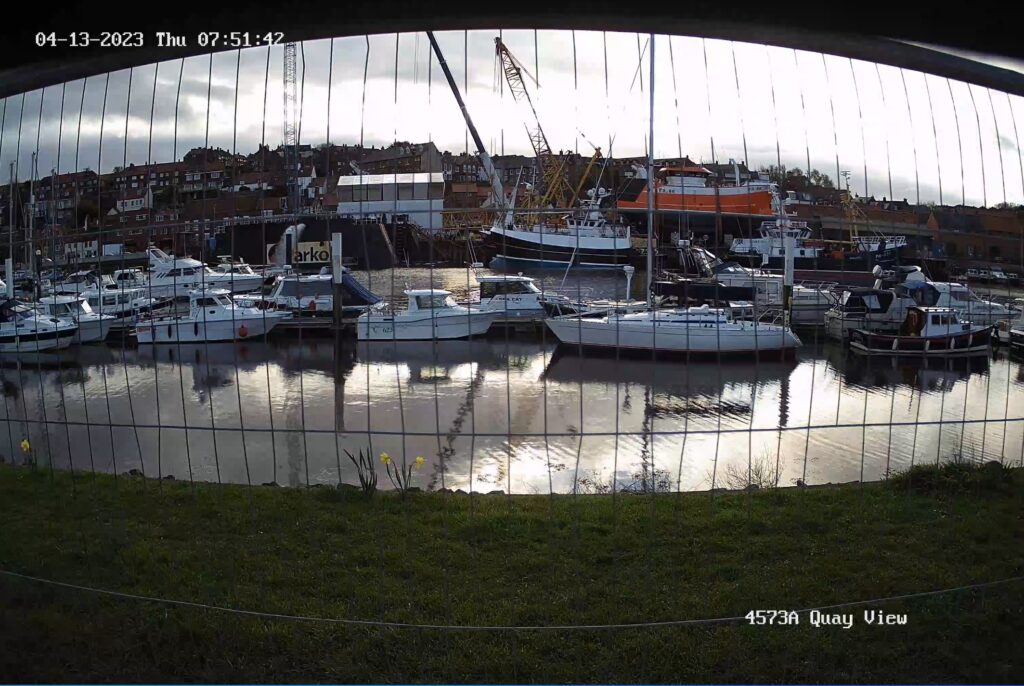
Two CCTV cameras were also installed at the location, one to view the top of the quay and one view along the quay wall, in order to promptly verify whether any of the tilt movements or vibrational results detected could be connected to site activities.
MONITORING PROJECT – DATA COLLECTION
The image below shows the data collected by the Tiltmeters and showed on MyMove IoT Platform where algorithms analyse the evolving tilts of the quay wall in relation to the river’s water level. Notably, at T06, a significant shift is observed as the sensor moves within proximity to the river. However, this movement is abruptly halted by a restraining bolt situated lower on the wall. This occurrence not only serves as an indication of structural displacement but also suggests a deficiency in the proper functionality of the restraining system.


Tidal movement data collected by tiltmeters
Regarding the data collected by the Vibrometers, vibrations surpassing the threshold of 1 mm/s are primarily observed on days when construction work is being conducted, while during the Easter period there appears to be a significant reduction in vibrational activity.


Vibrational data collected by a vibrometer
The presented water level data provides information regarding the fluctuations in water levels over time. The anomaly observed indicates a deviation in the data caused by a rope from a nearby boat.


Water level data collected by a water level detector
MONITORING PROJECT – DATA COLLECTION
Data was closely monitored during a crane construction and quay loading. The initial plan entailed lifting the boat and subsequently dismantling the crane. Contrary to expectations, it was observed that the quay wall remained remarkably stable during the boat lift, even with the utilization of a massive crane. This achievement could be attributed to the exceptional efforts of the crane operators in effectively isolating the front section of the quay wall.
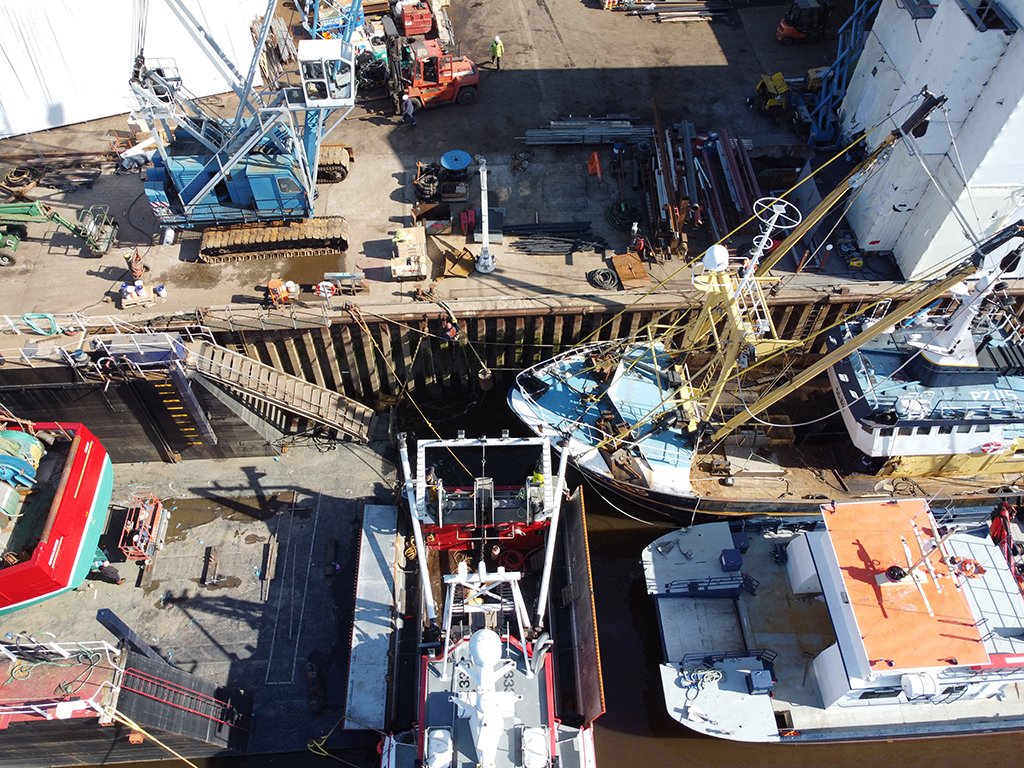
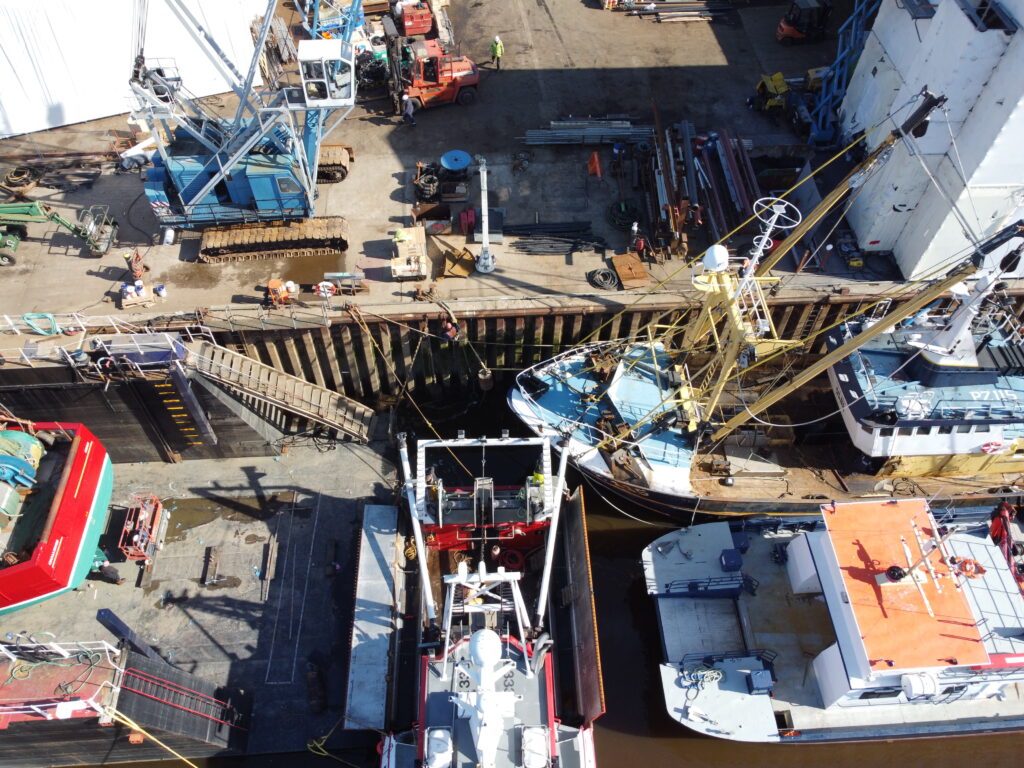
The image depicts three cranes positioned at the construction site, preparing to raise the orange boat on the right side and place it into the water. The crane situated on the left is a typical wharf crane commonly used for such operations. The middle crane has been brought to the site specifically to facilitate the construction of the large crane. Finally, the yellow crane on the right is an exceedingly large machine with a lifting capacity of 600 tons, intended for the task of hoisting the boat into the water.


